
Notes on gold and central banks (3 Nov 2009)
November 3, 2009 — drsubrotoroyMy response: “Who will? Central Banks as per the old gold exchange standard? There are well-known problems with all fixed exchange rate systems.”
Did Donald Trump & Bernie Sanders get their Trade Policy from my 1983 Cato talk?
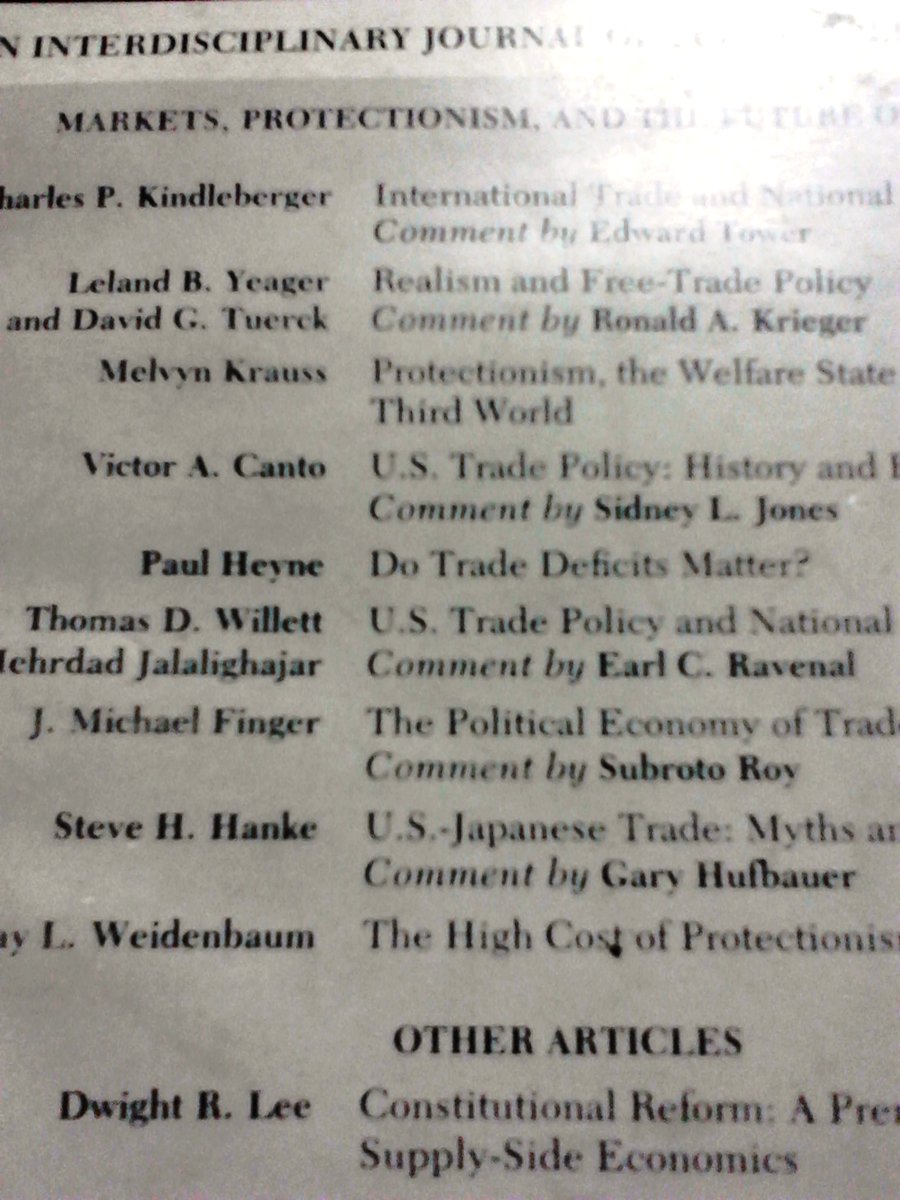
March 19, 2009 — drsubrotoroyIn the summer of 1983 Dr James Dorn of Cato Institute invited me (then in Menlo Park) to comment on the influential papers being given by the prominent trade economist Dr J Michael Finger.
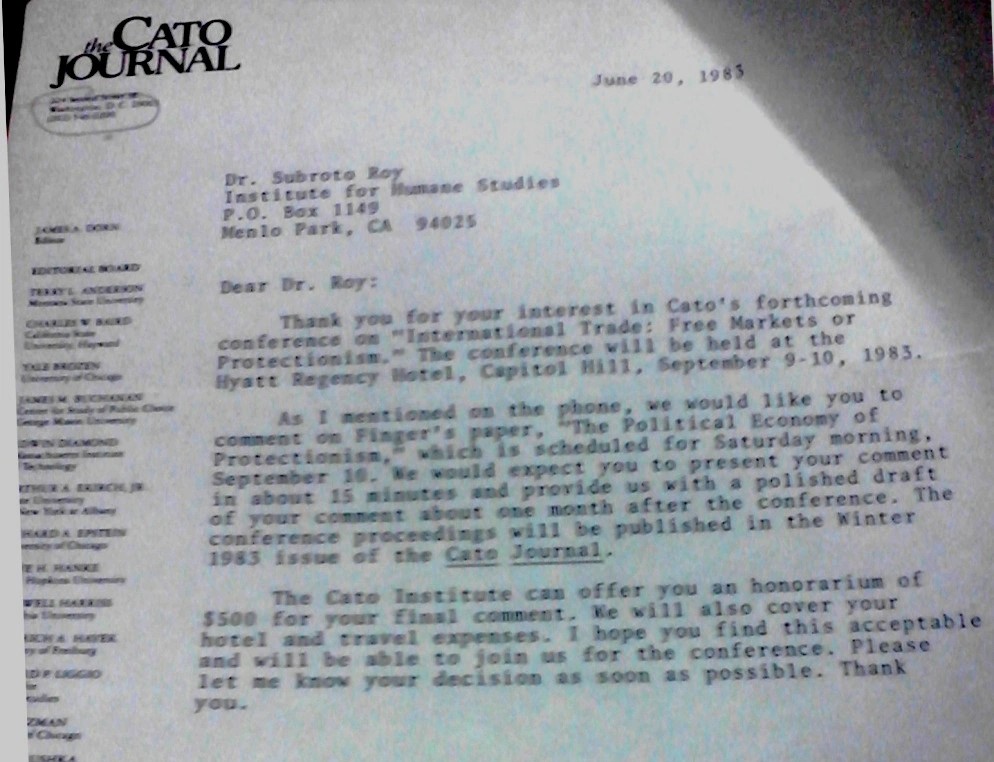
I think I might have said I hadn’t worked on trade since LSE days a decade earlier but Jim said something sweetly persuasive like “We want to put you in the limelight” — and limelight there was, a full house in Washington (the Capitol Hill Hyatt Regency), with the bright camera lights of C-Span and local television.
I do not recall what current trade issues dominated the agenda, certainly it was years before NAFTA or China were being discussed, perhaps tariff removal on US textiles, probably Japanese auto-imports: Michael Finger certainly gave a devastating example of the difficulty US beef exporters had entering Japan’s beef market at the time.
But whatever I said, as a 28 year old Indian from Cambridge and India, was very well received by that packed Washington audience. And I did not say much more than offer a Hahnian-Keynesian scepticism about textbook economic theory being divorced from ground realities.
[Twitter 21.10.2016 et seq: I recollect three interactions after the talk, Donald J Trump or someone like him was seated midway in the hall in an aisle, introduced himself praised the talk to me, and may have said “Remember the name”! (He looked like a “preppie”, like myself.) Bernie Sanders, or someone like him made a momentary comment as he charged by at speed; a third man said I “waxed eloquent”. Trump sat toffishly dressed in an aisle seat, congratulated me and introduced himself, Sanders charged out at speed after a momentary word…I recall three interactions after the talk, one each with Trump and Sanders, or someone like them.) I seemed to recall coming from Blacksburg by car to give the Washington talk, but the letter Jim Dorn sent was to Menlo Park, California, where I had been in the summer; and later in Fall 1983 I was visiting at Cornell; I have not yet been able to reconstruct how I travelled to Washington, I would be surprised if I drove from Ithaca and back but perhaps I did. (I had just driven from Blacksburg to California and back, then up to Ithaca).
[I apparently flew from Ithaca to Washington National, then stayed at the hotel for one night, and after my talk (and encounter with the future POTUS Trump), drove to Baltimore airport where I had to pick someone up and drove back to Ithaca in the rented car. The phone conversation about “limelight” must have been in the summer. Oddly enough, I was at Ithaca from Blacksburg teaching History of Economic Thought for a semester in the Economics Department because, from my point of view I could talk to Max Black in Philosophy, and from Cornell’s point of view, Ken Burdett the Economics chair told me, History Department students had demanded the course: those History Department students were led by Ms Ann Coulter, who became a quite quiet pupil in my class.]
Half a dozen years later at the University of Hawaii in March 1989 I amplified the argument a little bit as follows:
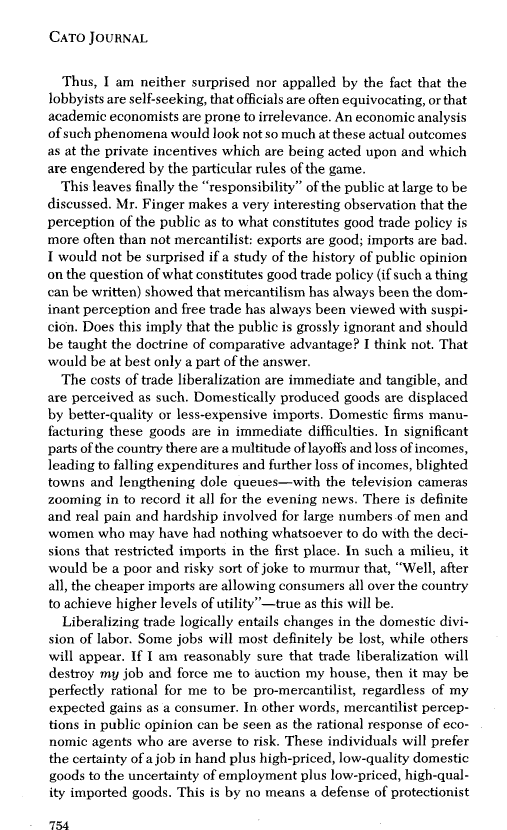
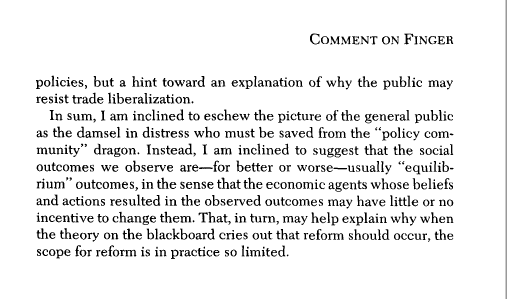
“Risk-aversion explains resistance to freer trade (and explains protectionism during a recession)
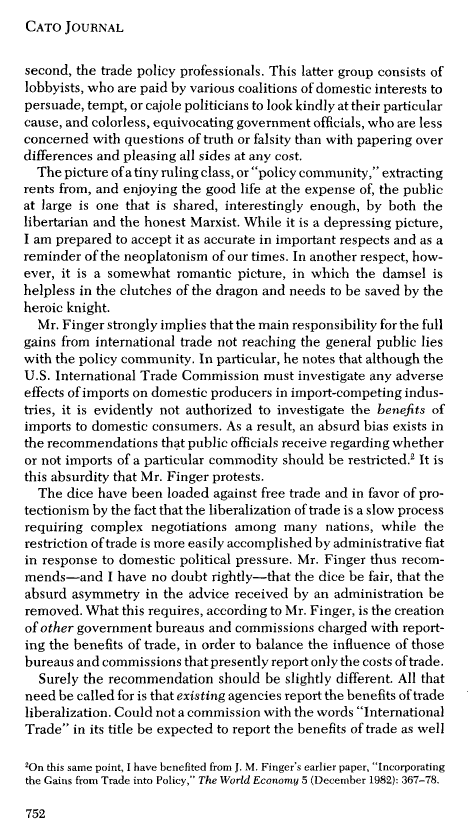
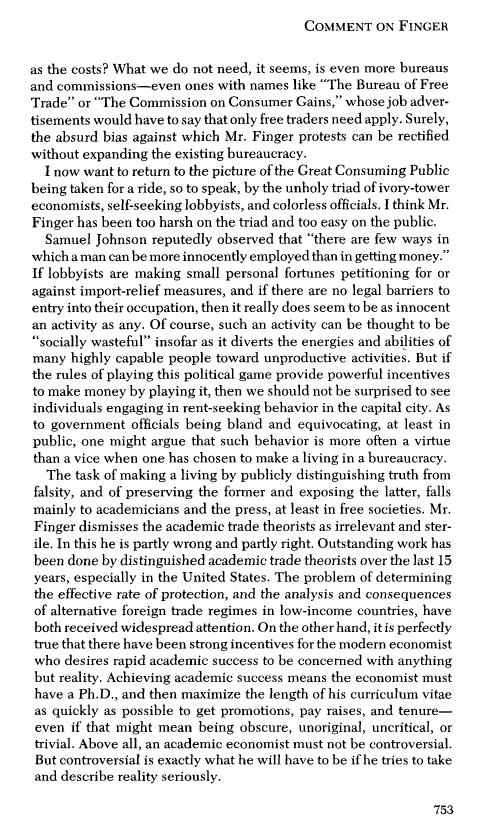
Textbook economics suggests world trade improves material welfare: consumers are better off when imports may compete freely in the home-market. Yet from Adam Smith’s critique of mercantilism to modern theories of rent-seeking, domestic producers in import-competing industries have been described as trying to restrict international trade by tariffs or other means. How is it producers so often succeed in persuading governments of the social costs of imports? Why are there not (or not as many, or not as powerful) consumer lobbies? Certainly there are high costs of organizing consumer lobbies relative to producer lobbies, but leaving that aside, is it possible consumers are ignorant and irrational? J. Michael Finger (1982, 1983/84) argued that in this respect consumers are in fact ignorant of their own best interests.
Roy (1983/84) suggested that a simple Keynesian observation offers a different explanation. A domestic household may be definitely better off by trade-liberalization on the expenditure side of its budget but the increased competitiveness of the economy accompanying liberalization may so decrease the expected value of its income that a risk-averse household would prefer the trade-protected status quo and have no incentive to lobby for trade-liberalization. Conversely, in a recession when the expected value of a household’s income declines, households have an incentive to lobby for trade-protection despite this worsening the expenditure side of their budgets.
The simplest of examples suffices to show all this. Let x1 be a non-traded domestic good, and x2 an imported good, and let a domestic household have preferences
U (x1, x2) = x1α . x2β
α + β < 1; 0 < α, β < 1 (1)
Let x1 be numeraire, p’ and p be the world and domestic prices of x2 respectively, and t be the tariff-rate on x2 such that p = (1 + t). p’. Let the household’s expected income be ya in the trade-protected state and yb in the trade-liberalized state, so its budget constraint is either
ya = x1 + (1 + t).p’. x2 in the trade-protected state (2a)
or
yb = x1 + p’. x2 in the trade-liberalized state (2b).
Maximizing (1) subject to (2a) gives a “final utility” in the trade-protected state, Ua*. Maximizing (1) subject to (2b) gives a “final utility” in the trade-liberalized state, Ub*.
Hence Ua* > Ub* as
[ya/yb] (α + β)/β > 1 + t where (α + β)/β > 1.
If income is certain in the trade-protected state but uncertain in the trade-liberalized state, a household’s risk-aversion will require loss in the expected utility of income in the trade-liberalized state to be offset by a gain in final utility that it receives as a consumer due to tariff-reduction.
E.g., let α = β = ½ and let the household have a certain income in the trade-protected state of $20,000; let it place a subjective probability of 1/4 on being unemployed with zero income in the trade-liberalized state, and 3/4 on maintaining the same income of $20,000.
Then Ua* > Ub* as [4/3]2 > 1 + t.
I.e., for any tariff-rate less than about 78% with these particular data, the household may rationally think itself better off in the trade-protected state than in the trade-liberalized state, and hence have no incentive to lobby for the latter.
Cooper (1987) remarked: “There should of course be a strong appeal to consumers of imported goods for removing restrictions. For a variety of reasons, political mobilization of consumers has been difficult in most countries. Many of these consumers also are employed in producing tradable goods, and they worry more about their jobs than about the purchasing power of a given wage. But most goods that move in international trade are not consumer goods. They are capital goods and intermediate products, and it should be easier to appeal to buyers of these intermediate products for import liberalization, because such buyers would enjoy a reduction in their costs.” The sentence italicized above may be consonant with the simple point made here.
References
Richard N. Cooper “Why liberalization meets resistance” in J. Michael Finger (ed.), The Uruguay Round, A Handbook on the Multilateral Trade Negotiations, World Bank, November 1987.
J. Michael Finger, “Incorporating the gains from trade into policy”, The World Economy, 5, December 1982, 367-78.
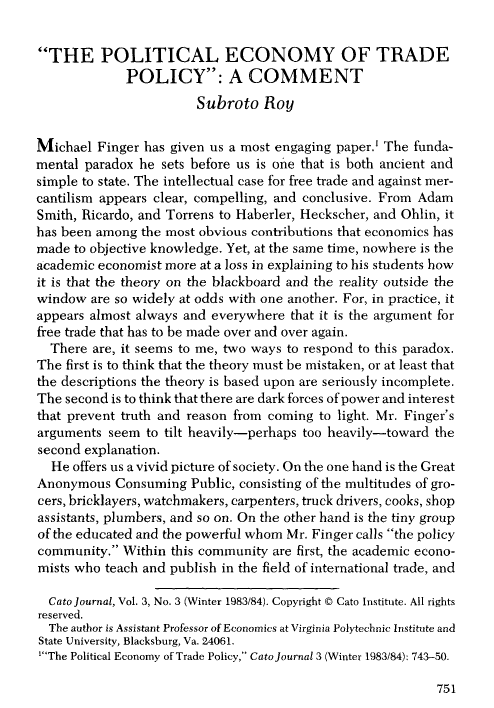
“The political economy of trade policy”, Cato Journal, 3, Winter 1983/84.
Subroto Roy, “The political economy of trade policy: comment”, Cato Journal, 3, Winter 1983/84″
I sent it to Economic Letters but the editor Professor Jerry Green rejected it, perhaps because it was too simple and unpretentious. And it remained unpublished until I put it on my blog in March 2009.
Yes it is relevant to the trade-problem America may face today, and yes perhaps both Mr Trump and Mr Sanders were in my audience at Cato, I do not know.
From Twitter 21.10.2016: I recollect three interactions after the talk, Donald J Trump or someone like him was seated midway in the hall in an aisle, praised the talk to me afterwards; he looked like a “preppie”, like myself. Bernie Sanders, or someone like him made a momentary comment as he charged by at speed; a third man (I think he was a Florida State professor who became a friend and later invited me there but I could not go) said I had “waxed eloquent”.
From Twitter 09.11.2016: Trump sat toffishly dressed in an aisle seat, congratulated me and introduced himself, Sanders charged out at speed after a momentary word…I recall three interactions after the talk, one each with Trump and Sanders, or someone like them
see too https://independentindian.com/2016/11/24/fixing-washington-on-improving-institutional-design-in-the-united-states/
from My American years
https://independentindian.com/thoughts-words-deeds-my-work-1973-2010/my-american-years-1980-96-battling-for-the-freedom-of-my-books/
I have put these documents here now in 2017 after recollecting in 2016 during the American election campaign that both Bernie Sanders and Donald J Trump had been present at that trade policy conference in Washington in September 1983 and both had interacted with me briefly! Mr Sanders had expressed a momentary word of praise and had charged out of the large crowd at speed with I think a small retinue of staff. (I asked someone who that had been, and recall Vermont being mentioned, and recall the spectacles and the fierce earnest expression.) Mr Trump had sat in an aisle seat in the middle and he had looked at me and I at him (we were both relatively young men in that middle aged milieu) as I had walked up to the podium. He was toffishly dressed, looking somewhat out of place in a nerdy conference of academics, journalists, politicians and policy wonks. As I had come down from the podium he had stood up and introduced himself as “Donald J Trump”, and said “Manhattan real estate” possibly upon my enquiry; he praised my talk quite profusely and might have said something like he was surprised that “coming from the part of the world” I did I had grasped what I had done about America.

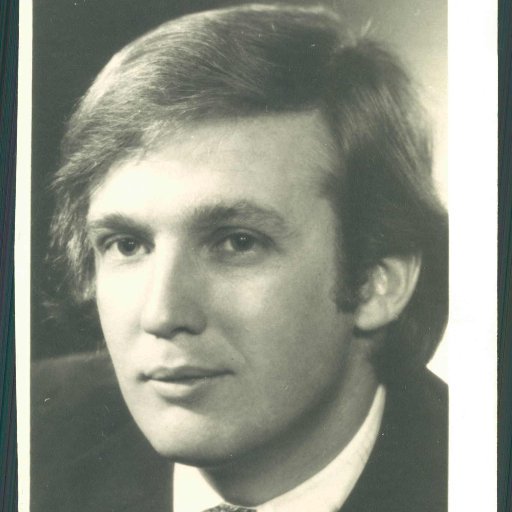
[I would have looked a year younger than this, Mr Trump a bit older than this…]
The encounter was no more than two a few minutes and ended with him saying “Remember the name”… which as it happens I did not even when I walked by his tall buildings in New York a decade later.
It was only when I heard his primary campaign speeches in the American Midwest about March 2016 that I said “Hey I said that”, and recalled my own argument and our meeting. Was the future American President conspicuous in that nerdy policy wonk conference of academics, congressional staff, journalists etc? I would say he was… in both dress and manner. “Make no mistake #Trumpisapolicywonk…a preppie by education, an American nationalist, a commonsense pragmaticist (Peirce)” I have said at Twitter, starting the hashtag mentioned. As it happened, earlier that summer I had stopped with my Sheltie puppy for a night at a motel in Little Rock, Arkansas, where Mrs Clinton was First Lady; a leprechaun could have told me, Hey, those two are going to square off in 2016… .
from Twitter 11 January 2019
Both of us were relatively young men in that crowd of journalists, policy wonks, congressional staffers, his stare at me was one of “Now who’s that, where’s he from?”; I noticed him at all because he was looking back at me, & I saw a brash well-dressed preppie, the jock at school.
Mr Trump had been at 2 o’clock to me staring back at me in the hall before my talk, and I have tried to recall the logistics: our panel had been asked to sit midway in the packed hall waiting our turn as a previous panel finished. Trump looked back to stare at me…
When our panel was called, Mr Trump’s eyes followed me as I walked past him up to the podium (Washington Capitol Hyatt 1983, perhaps a few black journalists or staffers, no one else of “colour” except myself), and I recall his face in the audience as I waited to speak & then did…
Ordinary workers were not being represented yet were massively affected by trade policy taken from econ textbooks, there was a disconnect, that was my 1983 Washington contribution, and I, under the bright glare of tv lights, had the whole hall in thrall, not just @realDonaldTrump.
As I walked down back from the podium, he stood up and introduced himself, and I was like “Ha! Gotcha, Preppie!”, he was profuse in his praise, and upon my enquiry introduced himself as “Manhattan real estate”, an oddity in that crowd… “Coming from the part of the world you do” was Mr Trump ‘s way of saying “How did you as an Indian manage to get all that about America?”, I had to leave, I had to meet someone at Baltimore airport, then drive to my visiting parents, left alone in Ithaca with my Sheltie..
“Remember the name” parting shot from Mr Trump as I left our conversation, I’d probably have had a job offer with him if I’d chatted on… but No Can Do.. I was visiting @Cornell, my Green Card was being processed by Virginia Tech… a manuscript in longhand.
And at @Cornell I was talking to Max Black, Wittgenstein’s pupil, then aged 74, and teaching a new course on History of Economic Thought that had been demanded of the Econ dept by History students led by Ms @AnnCoulter! .. a quiet pupil..
“Ordinary workers were not being represented yet were massively affected by trade policy taken from econ textbooks, there was a disconnect… my 1983 contribution to the American discn. #DemocraticDebate accepted this objective reason for the
@realDonaldTrump win” https://twitter.com/subyroy/status/1185057601026850816?s=20…
Jul 22
“Yes, they did get the idea from your paper” @Ibishblog tells me, to which I say Thanks… Back then there was no China issue but Japanese small cars… twitter.com/Ibishblog/stat…
.
Growth & Government Delusion (2008)
February 22, 2008 — drsubrotoroyGrowth & Government Delusion:
Progress Comes From Learning, Enterprise, Exchange, Not The Parasitic State
By Subroto Roy
First published in The Statesman, Editorial Page Special Article,
February 22, 2008
P Chidambaram, Montek Ahluwalia and Manmohan Singh, like their BJP predecessors, delude themselves and the country as a whole when they claim responsibility for phenomenal economic growth taking place. “My goal is to continue to maintain growth but at the same time the government reserves the right to make rapid adjustments depending upon the evolving international situation” is a typical piece of nonsensical waffle.
Honest Finance Ministers in any country cannot take personal responsibility for rates of economic growth nor is any government in the world nimble, well-informed and intelligent enough to respond to exogenous shocks in a timely manner. The UPA and NDA blaming one another for low growth or taking credit for high growth merely reveal the crude mis-education of their pretentious TV economists. There are far too many measurement and data problems as well as lead-and-lag problems for any credibility to attach to what is said.
Per capita real GDP
Indian businessmen and their politician/ bureaucratic friends seem to think “growth” refers to nominal earnings before tax for the corporate sector, or some such number that can be sold to visiting foreigners to induce them to park their money in India: “You will get a 10 per cent return if you invest in India” to which the visitor says “Oh that must mean India has 10 per cent growth going on”. Of such nonsense are expensive Davos and Delhi conferences made.
What is supposed to be measured when we speak of economic growth? It is annual growth of per capita inflation-adjusted Gross Domestic Product (National Income or Net National Product would be better if available). West Germany and Japan had the highest annual per capita real GDP growth-rates in the world starting from devastated post-War initial conditions. What were their rates? West Germany: 6.6 per cent in 1950-1960, falling to 3.5 per cent by 1960-1970, and 2.4 per cent by 1970-1978. Japan: 6.8 per cent in 1952-1960; 9.4 per cent in 1960-1970, 3.8 per cent in 1970-1978. Thus, only Japan in the 1960s measured more than 9 per cent annual growth of real per capita GDP.
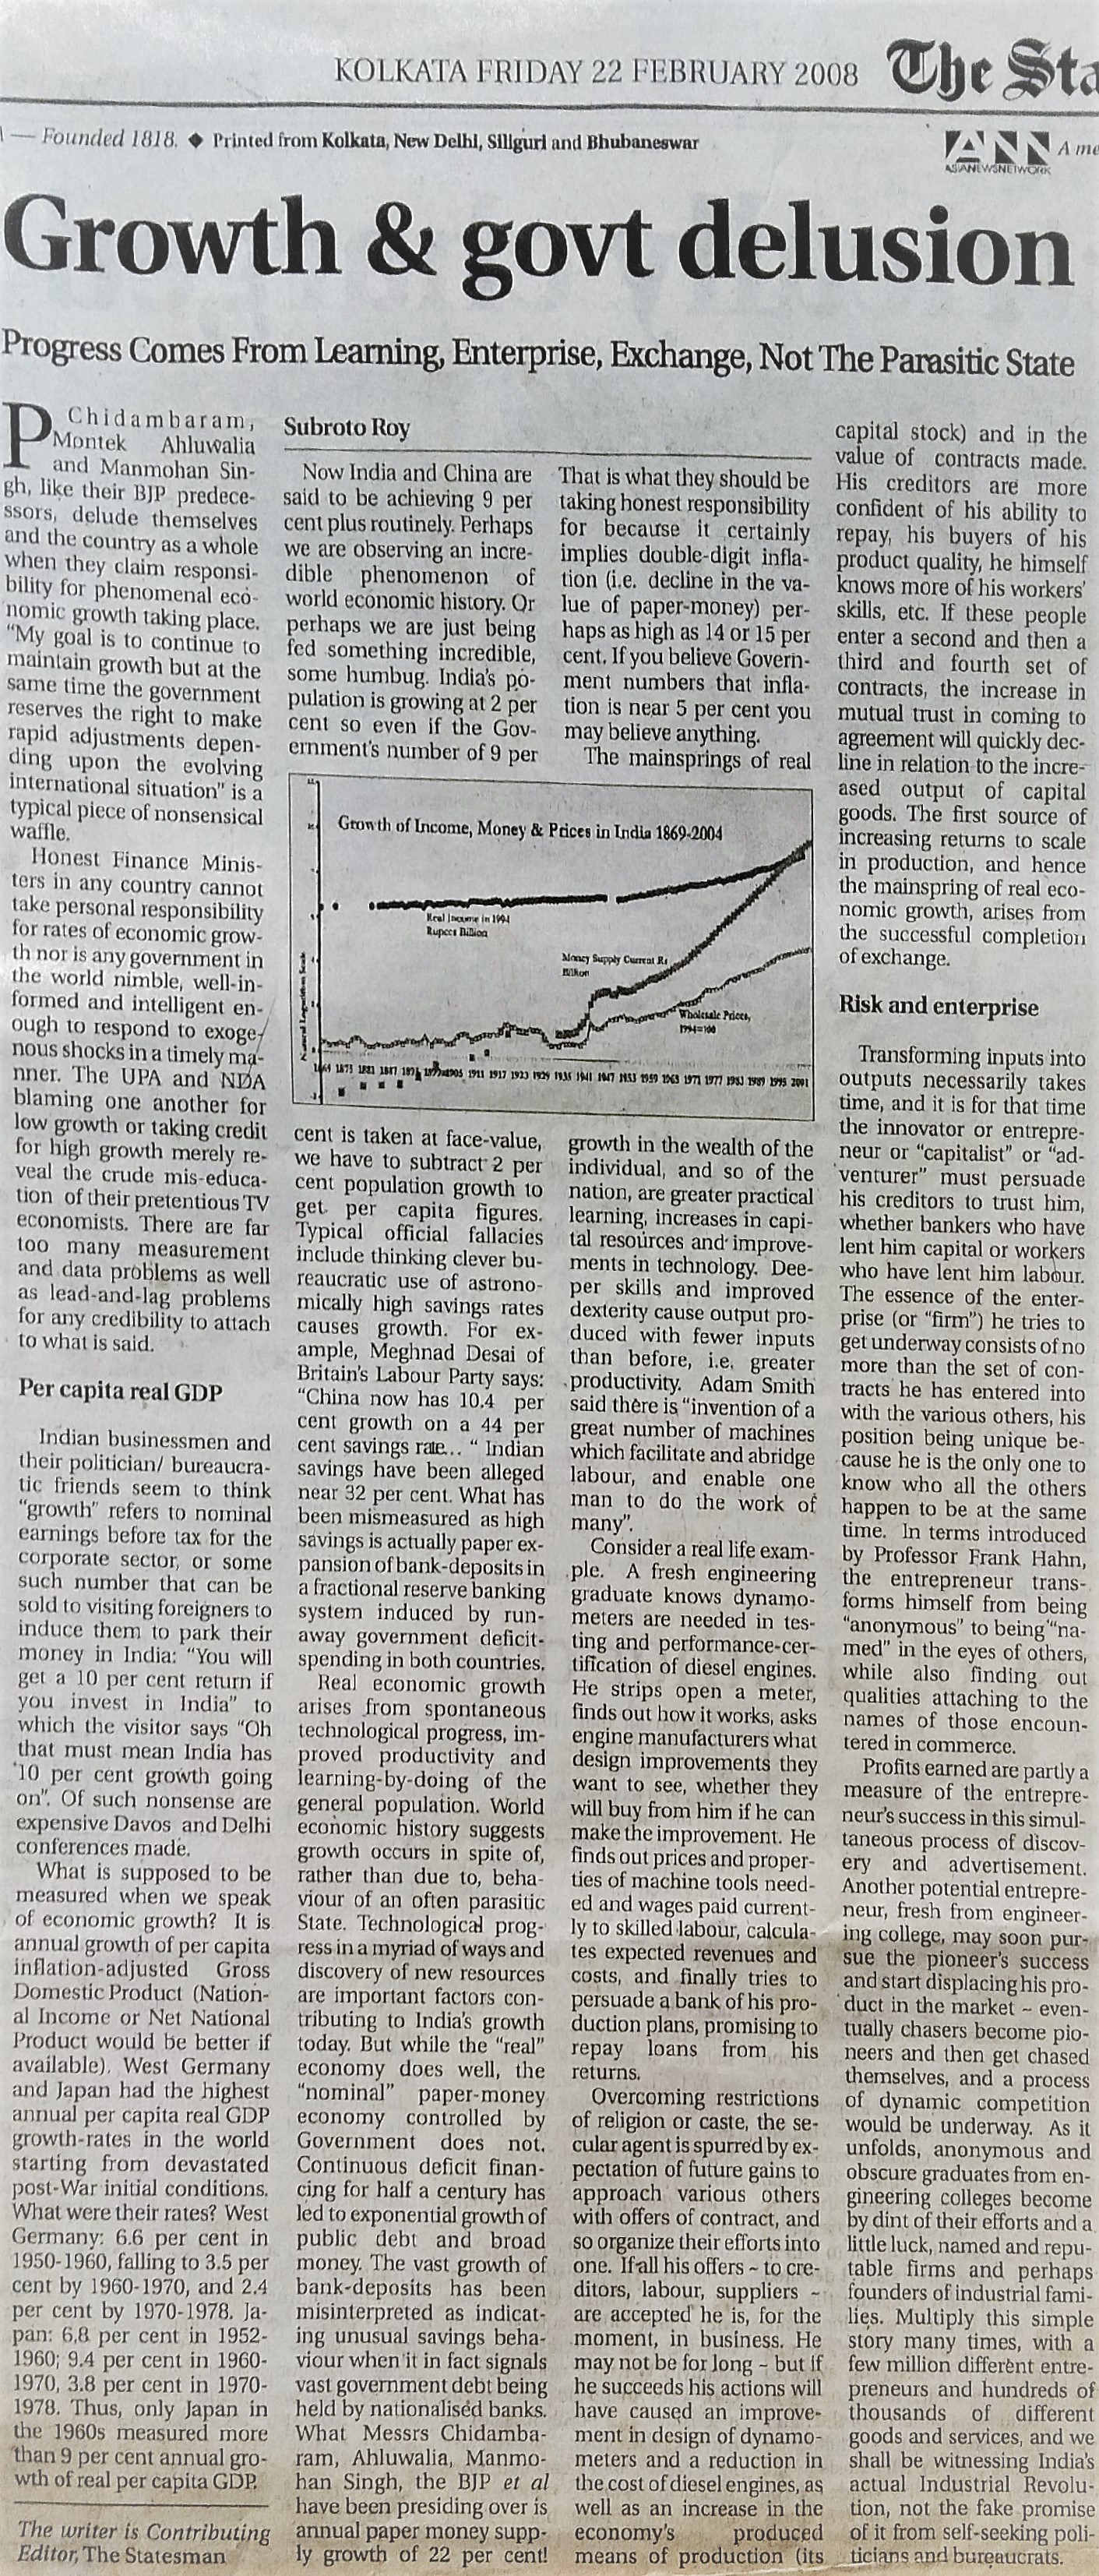
Now India and China are said to be achieving 9 per cent plus routinely. Perhaps we are observing an incredible phenomenon of world economic history. Or perhaps we are just being fed something incredible, some humbug. India’s population is growing at 2 per cent so even if the Government’s number of 9 per cent is taken at face-value, we have to subtract 2 per cent population growth to get per capita figures. Typical official fallacies include thinking clever bureaucratic use of astronomically high savings rates causes growth. For example, Meghnad Desai of Britain’s Labour Party says: “China now has 10.4 per cent growth on a 44 per cent savings rate… ” Indian savings have been alleged near 32 per cent. What has been mismeasured as high savings is actually paper expansion of bank-deposits in a fractional reserve banking system induced by runaway government deficit-spending in both countries.
Real economic growth arises from spontaneous technological progress, improved productivity and learning-by-doing of the general population. World economic history suggests growth occurs in spite of, rather than due to, behaviour of an often parasitic State. Technological progress in a myriad of ways and discovery of new resources are important factors contributing to India’s growth today. But while the “real” economy does well, the “nominal” paper-money economy controlled by Government does not.
Continuous deficit financing for half a century has led to exponential growth of public debt and broad money. The vast growth of bank-deposits has been misinterpreted as indicating unusual savings behaviour when it in fact signals vast government debt being held by nationalised banks. What Messrs Chidambaram, Ahluwalia,Manmohan Singh, the BJP et al have been presiding over is annual paper-money supply growth of 22 per cent! That is what they should be taking honest responsibility for because it certainly implies double-digit inflation (i.e. decline in the value of paper-money) perhaps as high as 14 or 15 per cent. If you believe Government numbers that inflationis near 5 per cent you may believe anything.
The mainsprings of real growth in the wealth of the individual, and so of the nation, are greater practical learning, increases in capital resources and improvements in technology. Deeper skills and improved dexterity cause output produced with fewer inputs than before, i.e. greater productivity. Adam Smith said there is “invention of a great number of machines which facilitate and abridge labour, and enable one man to do the work of many”.
Consider a real life example. A fresh engineering graduate knows dynamometers are needed in testing and performance-certification of diesel engines. He strips open a meter, finds out how it works, asks engine manufacturers what design improvements they want to see, whether they will buy from him if he can make the improvement. He finds out prices and properties of machine tools needed and wages paid currently to skilled labour, calculates expected revenues and costs, and finally tries to persuade a bank of his production plans, promising to repay loans from his returns.
Overcoming restrictions of religion or caste, the secular agent is spurred by expectation of future gains to approach various others with offers of contract, and so organize their efforts into one. If all his offers ~ to creditors, labour, suppliers ~ are accepted he is, for the moment, in business. He may not be for long ~ but if he succeeds his actions will have caused an improvement in design of dynamometers and a reduction in the cost of diesel engines, as well as an increase in the economy’s produced means of production (its capital stock) and in the value of contracts made. His creditors are more confident of his ability to repay, his buyers of his product quality, he himself knows more of his workers’ skills, etc. If these people enter a second and then a third and fourth set of contracts, the increase in mutual trust in coming to agreement will quickly decline in relation to the increased output of capital goods. The first source of increasing returns to scale in production, and hence the mainspring of real economic growth, arises from the successful completion of exchange.
Risk and enterprise
Transforming inputs into outputs necessarily takes time, and it is for that time the innovator or entrepreneur or “capitalist” or “adventurer” must persuade his creditors to trust him, whether bankers who have lent him capital or workers who have lent him labour. The essence of the enterprise (or “firm”) he tries to get underway consists of no more than the set of contracts he has entered into with the various others, his position being unique because he is the only one to know who all the others happen to be at the same time. In terms introduced by Professor Frank Hahn, the entrepreneur transforms himself from being “anonymous” to being “named” in the eyes of others, while also finding out qualities attaching to the names of those encountered in commerce.
Profits earned are partly a measure of the entrepreneur’s success in this simultaneous process of discovery and advertisement. Another potential entrepreneur, fresh from engineering college, may soon pursue the pioneer’s success and start displacing his product in the market ~ eventually chasers become pioneers and then get chased themselves, and a process of dynamic competition would be underway. As it unfolds, anonymous and obscure graduates from engineering colleges become by dint of their efforts and a little luck, named and reputable firms and perhaps founders of industrial families. Multiply this simple story many times, with a few million different entrepreneurs and hundreds of thousands of different goods and services, and we shall be witnessing India’s actual Industrial Revolution, not the fake promise of it from self-seeking politicians and bureaucrats.
see also 12 June 2009
India in World Trade & Payments (2007)
February 12, 2007 — drsubrotoroyOur Trade & Payments
by
SUBROTO ROY
First published in The Sunday Statesman, Feb 11 2007, The Statesman, Feb 12 2007
Editorial Page Special Article
TWO and a half millennia ago, the Greeks described how brightly coloured textiles imported from India were popular among the Persians. Five centuries later, the Roman historian Pliny complained that India every year “took from Italy a hundred million sesterces in return for spices, perfumes and ornaments”. Montesquieu observed in 1748: “All peoples who have traded with India have always taken metals there and brought back commodities. Indians need only our metals, which are the signs of value. In all times those who deal with India will take silver there and bring back none”.
During the British period, India remained a great trading nation. JM Keynes found Britain, the world’s largest exporter in 1913, exporting more to India than anywhere else, and Germany, the world’s fastest growing economy in 1913, receiving 5 percent of its imports from India and sending it 1.5 percent of exports, making India the sixth largest exporter to Germany (after the USA, Russia, Britain, Austria-Hungary, France) and eighth largest importer from it (after Britain, Austria-Hungary, Russia, France, the USA, Belgium, Italy). India’s share of world exports during 1870-1914 may have been about 3-4 per cent. As of 1917-1918, India’s balance of payments and fiscal budget appear idyllic: an export surplus of £61.42 million, official reserves of £66.53 million, total claims on the rest of the world of £127.5 million (or 32.85 million troy ozs of gold), and a 1916-1917 budget surplus of £6,594,885.
Even at mid-20th Century, India was still a trading power with 2 percent of world exports and a rank of 16 in the world economy after the USA, Britain, West Germany, France, Canada, Belgium, Holland, Japan, Italy, Australia, Sweden, Venezuela, Brazil, Malaya and Switzerland.
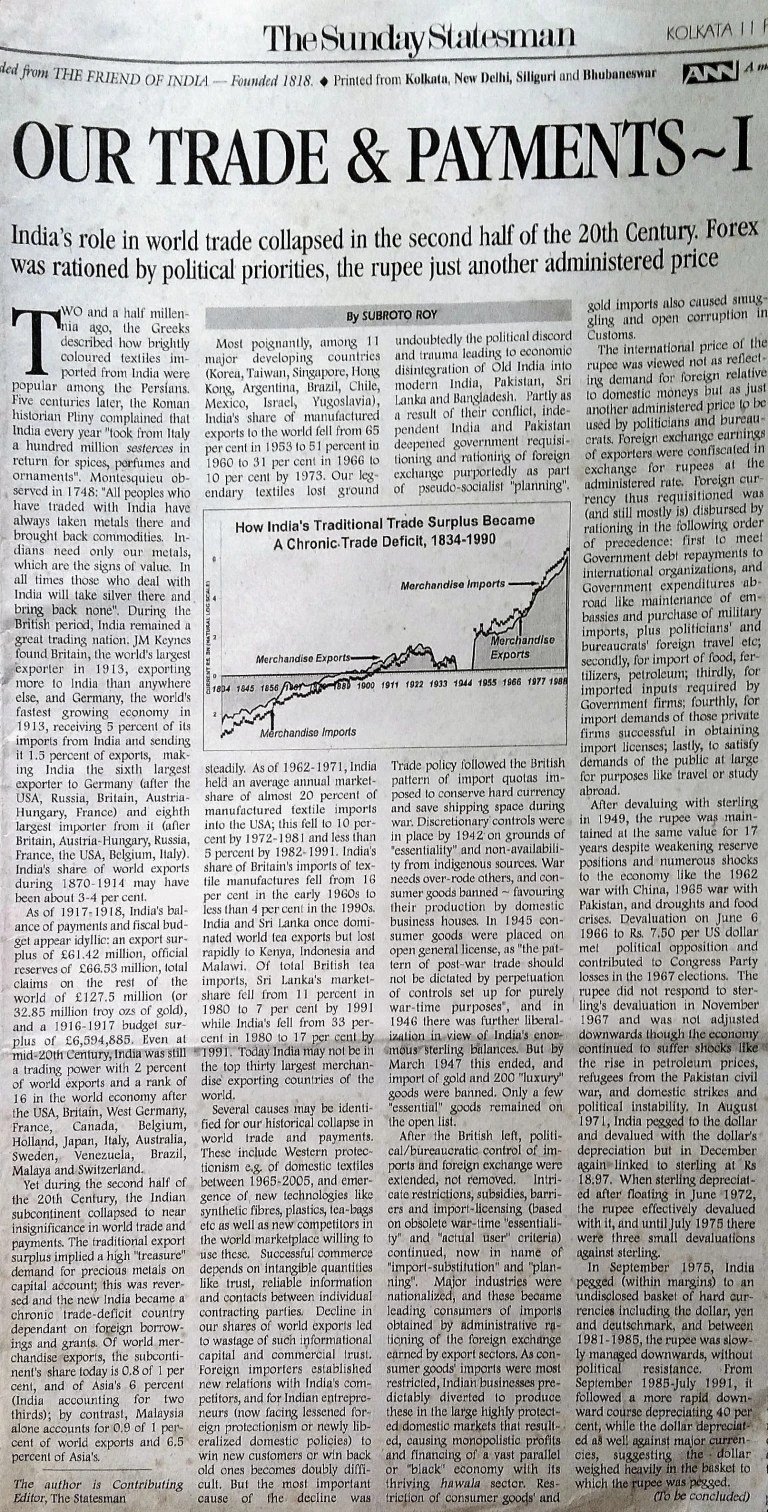
Yet during the second half of the 20th Century, the Indian subcontinent collapsed to near insignificance in world trade and payments. The traditional export surplus implied a high “treasure” demand for precious metals on capital account; this was reversed and the new India became a chronic trade-deficit country dependant on foreign borrowings and grants. Of world merchandise exports, the subcontinent’s share today is 0.8 of 1 per cent, and of Asia’s 6 percent (India accounting for two thirds); by contrast, Malaysia alone accounts for 0.9 of 1 percent of world exports and 6.5 percent of Asia’s. Most poignantly, among 11 major developing countries (Korea, Taiwan, Singapore, Hong Kong, Argentina, Brazil, Chile, Mexico, Israel, Yugoslavia), India’s share of manufactured exports to the world fell from 65 per cent in 1953 to 51 percent in 1960 to 31 per cent in 1966 to 10 per cent by 1973. Our legendary textiles lost ground steadily. As of 1962-1971, India held an average annual market-share of almost 20 percent of manufactured textile imports into the USA; this fell to 10 percent by 1972-1981 and less than 5 percent by 1982-1991. India’s share of Britain’s imports of textile manufactures fell from 16 per cent in the early 1960s to less than 4 per cent in the 1990s. India and Sri Lanka once dominated world tea exports but lost rapidly to Kenya, Indonesia and Malawi. Of total British tea imports, Sri Lanka’s market-share fell from 11 percent in 1980 to 7 per cent by 1991 while India’s fell from 33 percent in 1980 to 17 per cent by 1991. Today India may not be in the top thirty largest merchandise exporting countries of the world.
Several causes may be identified for our historical collapse in world trade and payments. These include Western protectionism e.g. of domestic textiles between 1965-2005, and emergence of new technologies like synthetic fibres, plastics, tea-bags etc as well as new competitors in the world marketplace willing to use these. Successful commerce depends on intangible quantities like trust, reliable information and contacts between individual contracting parties. Decline in our shares of world exports led to wastage of such informational capital and commercial trust. Foreign importers established new relations with India’s competitors, and for Indian entrepreneurs (now facing lessened foreign protectionism or newly liberalized domestic policies) to win new customers or win back old ones becomes doubly difficult.
But the most important cause of the decline was undoubtedly the political discord and trauma leading to economic disintegration of Old India into modern India, Pakistan, Sri Lanka and Bangladesh. Partly as a result of their conflict, independent India and Pakistan deepened government requisitioning and rationing of foreign exchange purportedly as part of pseudo-socialist “planning”.
Trade policy followed the British pattern of import quotas imposed to conserve hard currency and save shipping space during war. Discretionary controls were in place by 1942 on grounds of “essentiality” and non-availability from indigenous sources. War needs over-rode others, and consumer goods banned ~ favouring their production by domestic business houses. In 1945 consumer goods were placed on open general license, as “the pattern of post-war trade should not be dictated by perpetuation of controls set up for purely war-time purposes”, and in 1946 there was further liberalization in view of India’s enormous sterling balances. But by March 1947 this ended, and import of gold and 200 “luxury” goods were banned. Only a few “essential” goods remained on the open list.
After the British left, political/bureaucratic control of imports and foreign exchange were extended, not removed. Intricate restrictions, subsidies, barriers and import-licensing (based on obsolete war-time “essentiality” and “actual user” criteria) continued, now in name of “import-substitution” and “planning”. Major industries were nationalized, and these became leading consumers of imports obtained by administrative rationing of the foreign exchange earned by export sectors. As consumer goods’ imports were most restricted, Indian businesses predictably diverted to produce these in the large highly protected domestic markets that resulted, causing monopolistic profits and financing of a vast parallel or “black” economy with its thriving hawala sector. Restriction of consumer goods’ and gold imports also caused smuggling and open corruption in Customs. The international price of the rupee was viewed not as reflecting demand for foreign relative to domestic moneys but as just another administered price to be used by politicians and bureaucrats. Foreign exchange earnings of exporters were confiscated in exchange for rupees at the administered rate. Foreign currency thus requisitioned was (and still mostly is) disbursed by rationing in the following order of precedence: first to meet Government debt repayments to international organizations, and Government expenditures abroad like maintenance of embassies and purchase of military imports, plus politicians’ and bureaucrats’ foreign travel etc; secondly, for import of food, fertilizers, petroleum; thirdly, for imported inputs required by Government firms; fourthly, for import demands of those private firms successful in obtaining import licenses; lastly, to satisfy demands of the public at large for purposes like travel or study abroad.
After devaluing with sterling in 1949, the rupee was maintained at the same value for 17 years despite weakening reserve positions and numerous shocks to the economy like the 1962 war with China, 1965 war with Pakistan, and droughts and food crises. Devaluation on June 6 1966 to Rs. 7.50 per US dollar met political opposition and contributed to Congress Party losses in the 1967 elections. The rupee did not respond to sterling’s devaluation in November 1967 and was not adjusted downwards though the economy continued to suffer shocks like the rise in petroleum prices, refugees from the Pakistan civil war, and domestic strikes and political instability. In August 1971, India pegged to the dollar and devalued with the dollar’s depreciation but in December again linked to sterling at Rs 18.97. When sterling depreciated after floating in June 1972, the rupee effectively devalued with it, and until July 1975 there were three small devaluations against sterling. In September 1975, India pegged (within margins) to an undisclosed basket of hard currencies including the dollar, yen and deutschmark, and between 1981-1985, the rupee was slowly managed downwards, without political resistance. From September 1985-July 1991, it followed a more rapid downward course depreciating 40 per cent, while the dollar depreciated as well against major currencies, suggesting the dollar weighed heavily in the basket to which the rupee was pegged.
1991 reforms
Narasimha Rao, P Chidambaram and others received from Rajiv Gandhi in his last months the results of a “perestroika-for-India” project, and started a process of economic liberalisation. Chidambaram said at the time the reforms “were not miraculous” but based on rewriting the Congress manifesto: “We were ready when we came back to power in 1991”.
On July 1 1991, the rupee devalued 9 percent and on July 3 a further 11 percent. The new Government’s March 1 1992 Budget placed the rupee experimentally on a dual rate, implicitly taxing exporters who had to surrender 40 percent of their forex at an officially determined rate and could sell 60 percent in an open market. On March 1 1993, the rupee began to be made convertible for current account transactions, i.e. for import and export of goods and services. Trade reforms included removing many import quotas and some export subsidies. But grave fiscal and monetary problems were not (and have never been) addressed with any seriousness.
Balance of payments
The “balance of payments” sums a country’s current and capital accounts. In Western countries, the capital account consists of net trading in long and short-term securities like private stock and government debt ~ domestic securities being bought and sold freely by foreign residents and foreign securities by domestic residents. Prices determined by competitive trading are very sensitive to interest-rate differences. In India (and Pakistan etc) genuine capital account transactions have not existed since the 1930s, and do so only in highly distorted form even today. The traditional export surplus and positive current account, balanced by net inflow of precious metals, had been wiped out and current account deficits were coupled with overvalued currencies and closed capital markets – along with repressive financial policies causing capital flight of an elite nomenklatura. The inherent risk of unproductive use of funds by borrowers and consumers of forex (mostly Government) were shifted to export and other hard-currency earning sectors.
In particular, a severe trade-deficit had followed petroleum-price rises in the late 1970s, which continues today. There has been some exploration, discovery and extraction of domestic supplies of oil and gas, but no significant move to conserve or find economical alternatives to use of imported energy. (Indeed a coal-exporting petroleum-importing nation with the most heavily used railways in the world made an unprovoked decision to abolish steam-locomotives in favour of diesel and electric. And now, very expensive foreign nuclear plants are planned to be imported on a turnkey basis under a false assumption these will help India’s energy sector.)
India gained from exporting temporary workers to the Gulf since the 1970s but that could hardly finance the increased oil bill. Instead there has been large growth of foreign debt since the 1970s, mostly owed by the Government (and recently by large private businesses) to Western financial markets via brokerage of Western governments and organizations they control. India’s foreign debt amounts to more than $100 being owed by each of our one billion citizens, each of us having to earn five or six dollars every year on average just to meet interest payments due to foreign creditors.
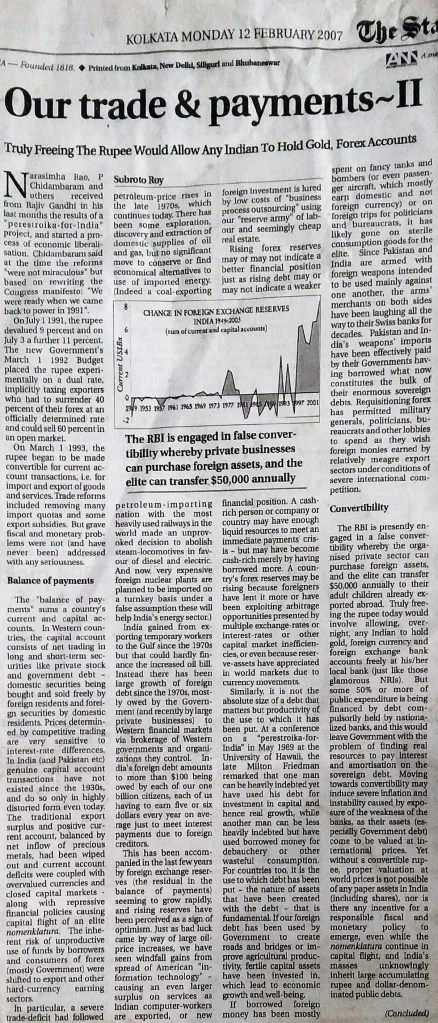
This has been accompanied in the last few years by foreign exchange reserves (the residual in the balance of payments) seeming to grow rapidly, and rising reserves have been perceived as a sign of optimism. Just as bad luck came by way of large oil-price increases, we have seen windfall gains from spread of American “information technology” ~ causing an even larger surplus on services as Indian computer-workers are exported, or new foreign investment is lured by low costs of “business process outsourcing” using our “reserve army” of labour and seemingly cheap real estate.
Rising forex reserves may or may not indicate a better financial position just as rising debt may or may not indicate a weaker financial position. A cash-rich person or company or country may have enough liquid resources to meet an immediate payments’ crisis ~ but may have become cash-rich merely by having borrowed more. A country’s forex reserves may be rising because foreigners have lent it more or have been exploiting arbitrage opportunities presented by multiple exchange-rates or interest-rates or other capital market inefficiencies, or even because reserve-assets have appreciated in world markets due to currency movements.
Similarly, it is not the absolute size of a debt that matters but productivity of the use to which it has been put. At a conference on a “perestroika-for-India” in May 1989 at the University of Hawaii, the late Milton Friedman remarked that one man can be heavily indebted yet have used his debt for investment in capital and hence real growth, while another man can be less heavily indebted but have used borrowed money for debauchery or other wasteful consumption.
For countries too, it is the use to which debt has been put ~ the nature of assets that have been created with the debt ~ that is fundamental. If our foreign debt has been used by Government to create roads and bridges or improve agricultural productivity, fertile capital assets have been invested in, which lead to economic growth and well-being.
If borrowed foreign money has been mostly spent on fancy tanks and bombers (or even passenger aircraft, which mostly earn domestic and not foreign currency) or on foreign trips for politicians and bureaucrats, it has likely gone on sterile consumption goods for the elite. Since Pakistan and India are armed with foreign weapons intended to be used mainly against one another, the arms’ merchants on both sides have been laughing all the way to their Swiss banks for decades. Pakistan and India’s weapons’ imports have been effectively paid by their Governments having borrowed what now constitutes the bulk of their enormous sovereign debts. Requisitioning forex has permitted military generals, politicians, bureaucrats and other lobbies to spend as they wish foreign monies earned by relatively meagre export sectors under conditions of severe international competition.
False convertibility
The RBI is presently engaged in a false convertibility whereby the organised private sector can purchase foreign assets, and the elite can transfer $50,000 annually to their adult children already exported abroad. Truly freeing the rupee today would involve allowing, overnight, any Indian to hold gold, foreign currency and foreign exchange bank accounts freely at his/her local bank (just like those glamorous NRIs). But some 50% or more of public expenditure is being financed by debt compulsorily held by nationalized banks, and this would leave Government with the problem of finding real resources to pay interest and amortisation on the sovereign debt. Moving towards convertibility may induce severe inflation and instability caused by exposure of the weakness of the banks, as their assets (especially Government debt) come to be valued at international prices. Yet without a convertible rupee, proper valuation at world prices is not possible of any paper assets in India (including shares), nor is there any incentive for a responsible fiscal and monetary policy to emerge, even while the nomenklatura continue in capital flight, and India’s masses unknowingly inherit large accumulating rupee and dollar-denominated public debts.
Economic Assessment of India-USA Merchandise Trade 1962-1992
July 27, 1993 — drsubrotoroy
Author’s Note July 2007: This was a study done by me 14 years ago when I was an economic consultant in Washington DC, USA. It emerged from but was independent of the work on India’s exports and exchange-rates I had done as a consultant at the International Monetary Fund. It has not been published before though a few pages were published in an ICRIER study in 1994.
An Economic Assessment of India-United States Merchandise Trade
by Subroto Roy1]/
July 1993
1. Introduction
The aim of this study will be to give an economic assessment of the long-run trends in merchandise trade between the United States and India over the period 1962-1992.
Two basic facts have governed the long-run path and pattern of India-United States merchandise trade. One has to do with the relative decline and growth of the Indian and American economies respectively since the Second World War. The other has to do with the trade-regimes which have prevailed in each country.
On the American side, the market-based principles which are supposed to govern the United States economy have been in practice egregiously compromised by American protectionism of the domestic textiles and clothing industries — key sectors in which India and other countries of the subcontinent have held some traditional comparative advantage as exporters in the world economy. On the Indian side, the Indian economy has been egregiously distorted for decades by what can be characterized only as failed economic policies ever since the Second Five Year Plan.
Sections 2-4 briefly describe aspects of this historical and institutional background to the merchandise transactions between the two countries. Section 2 indicates the asymmetry which has come about in the relative positions of India and the United States in the world economy. Section 3 outlines the main features of American protectionism with respect to textiles and clothing. Section 4 outlines the main distortions of the trade and payments regime which has prevailed in India with respect to exports from the United States and other countries.
Sections 5 and 6 then examine the major trends in American imports from India and the major trends in Indian imports from the United States respectively. Section 7 summarizes the findings and raises some questions for policy-discussion.
Tables in the text and the Appendix give the data supporting the thesis of the study. Table 2.1. indicates the local and global sizes of the Indian and other subcontinental economies. Tables 5.1 and 5.2, reproduced from Safadi & Yeats (1993), describe the destination of the subcontinent’s exports and product composition to North America specifically. Table 5.3. describes the nominal and real changes in major Indian exports to the USA from 1962-1991. Table 5.4 and Chart 5.1. describe the changing market-share of India and Pakistan in certain key import-markets in the USA and Britain between 1962-1991. Table 5.5. indicates real growth of the subcontinent’s exports of clothing to major industrial countries in recent years. Tables 6.1-6.3 describe the major trends in American exports to India between 1962-1991 at current prices, while Table 6.4. describes the nominal and real changes in major American exports to India during the period.
Finally, for purposes of future research, Tables A.1 and A.2 in the Appendix give detailed United States Commerce Department data of all India-United States merchandise trade in the current period 1989-1992.[2]/
2. Relative Decline and Growth
Since the Second World War, India has drastically declined from moderate to insignificant size as a trading power in the world economy, while the United States has grown to become the predominant national economy in world trade and payments.
India’s precipitous decline can be indicated by a few examples.
In the era 1757-1947 “India was unquestionably one of the great trading nations of Asia”[3]/, indeed of the world economy as a whole. While precise calculations cannot be made of the costs and benefits of British influence in India during this time, it is clear that the Indian economy both gained from British activity in promoting new products, manufactures, investment and infrastructure in the country, as well as lost from iniquitous commercial policies, taxation and imperial charges imposed by the British Government.
Britain was the world’s largest economy and India is reported to have been the single largest destination of British exports.[4]/ Germany, the world’s fastest growing economy, received as much as 5 percent of its total imports from India in 1913, and sent 1.5 percent of its exports to India, making India the sixth largest exporter to Germany (after the USA, Russia, Britain, Austria-Hungary and France) and the eighth largest importer from it (after Britain, Austria-Hungary, Russia, France, the USA, Belgium and Italy.)[5]/ Throughout this era, the Indian economy generally showed an export surplus on merchandise account, and an excess demand only for precious metals on capital account.
India’s share of world exports were an estimated 2.5 per cent in 1867/68, 3.4 percent in 1880, 4.1 percent in 1890, 3.7 percent in 1897 and 4 per cent in 1913.[6]/ As late as the mid-1950s, just before the onset of the Government of India’s Second Five Year Plan, India could have been still considered a significant trading power with a share of 2 percent of world exports and a rank of 16 in the world economy (following the USA, Britain, West Germany, France, Canada, Belgium, Holland, Japan, Italy, Australia, Sweden, Venezuela, Brazil, Malaya and Switzerland).[7]/
Today the combined shares of India and all other countries of the subcontinent together amount to about 0.8 of 1 percent of world exports, India’s share being 0.54 of 1 percent. As can be seen from Table 2.1, the subcontinent accounts for just 6 percent of Asia’s total exports to the world, of which the Indian economy accounts for about two thirds. By way of comparison, Malaysia on its own accounts for 6.5 percent of Asia’s total exports and almost 0.9 of 1 percent of world exports. More poignant perhaps has been India’s loss of share of manufactured exports relative to other developing countries. Of 11 major developing countries (including Korea, Taiwan, Singapore, Hong Kong, Argentina, Brazil, Chile, Mexico, Israel and Yugoslavia), India’s share of the total manufactured exports of these countries fell from a dominant 65 percent in 1953 to 51 percent in 1960 to 31 percent in 1966 to 10 percent by 1973.[8]/
Other indicators of India’s loss of export competitiveness appear in the decline of traditional exports like textile manufactures and tea. India’s textile manufactures were legendary for centuries but have lost ground steadily. As late as 1962-1971, India held an average annual market-share of almost 20 percent of all manufactured textile imports into the United States. This fell to 10 percent in 1972-1981 and to less than 5 percent in 1982-1991. India’s share of Britain’s imports of textile manufactures has fallen from 16 percent in the early 1960s to less than 4 percent in the 1990s. This decline has been due in part to American and European protectionism of domestic textiles, and in part to Indian economic trade and exchange-rate policies.
In case of tea, India and Sri Lanka once dominated world exports but have both lost competitiveness rapidly to other exporting countries, especially Kenya, Indonesia and Malawi. Sri Lanka’s market-share of total British tea imports fell from 11 percent in 1980 to 7 percent in 1991 while India’s share of the same market has fallen even more drastically from 33 percent in 1980 to 17 percent in 1991.
Altogether, India, with the world’s second largest population, has now become the 31st largest exporting country in the world economy. Total Indian exports of $18 billion in 1990 were lower in absolute terms than the exports of China and every newly industrializing country in East and South East Asia; Brazil, Venezuela, South Africa, Saudi Arabia, and every country in West Europe and North America except Portugal, Greece and Iceland.[9]/ In proportion to India’s great size, the ranking would be far more adverse.
The basic asymmetry in analyzing India-United States trade is indicated by the fact that during the same period as India’s precipitous decline, the United States has grown to become the single largest national economy in the world.
The shares of the United States (and Britain respectively) in world exports were 12 percent (20 percent) in 1880; 14 percent (16 percent) in 1900; 13 percent (15 percent) in 1913; and 12 percent (18 percent) in 1937.[10]/ After the Second World War and the decline of the British economy, the United States unambiguously became the world’s predominant national economy. The United States was the keystone of the international monetary system following the Bretton Woods Conference in December 1945. At the same time, American exports accounted for as much as 20 percent of world exports in the 1950s, decreasing to 12 percent by the 1990s following the recoveries of Germany and Japan and the high performances of some East and South East Asian economies.[11]/
The growing asymmetry in the positions of India and the United States as exporting economies may be summarized by their respective shares in world exports. The ratio of India’s share in world exports to the U. S. share of world exports was 1:3 as of 1913, which became 1:10 as of 1955, and has become 1:24 as of 1990. Such an asymmetry may be expected to be an implicit factor explaining the course of bilateral economic discussions between the Governments of the two countries, as well as transactions between private parties.
3. American Protectionism in Textiles and Clothing
The second basic fact governing the path and pattern of India-United States trade has had to do with the administration of economic policy in each country.
According to the market-based principles which are supposed to govern the United States economy, American demand for Indian imports would have been driven solely by private sector demand conditions in the U. S. economy. The United States Government would not have been expected to intervene in limiting the value of the potential contracts made between private American importers and private Indian exporters. The main factors affecting American demand-decisions for Indian exports would then have been identified as relative costs, and the preferences and income-levels of American consumers.
That is, by textbook economic principles, the main factors affecting demand-decisions regarding American imports from India would have been identified as:
(a) the cost and quality of an Indian product relative to similar products from alternative suppliers including domestic producers;
(b) the exchange-rate of the Indian rupee with respect to the United States dollar;
(c) the macroeconomic condition of the United States economy.
In practice, volume restrictions imposed by the United States Government to protect domestic producers have been critical factors determining the pattern of exports from India and other developing countries to the United States. This has hit hardest via the so-called “Multi-Fibre Arrangement” (MFA) affecting textiles and clothing, the two key export sectors of India and other countries in the subcontinent.
The roots of this aspect of American protectionism are to be found in the early 1960s, in what was supposed to be a temporary short-term measure to protect the United States textile and clothing industry. Instead of imposing global protective quotas under the GATT with respect to all textile and clothing exporters, the United States (and European Community) chose to discriminate in a country-specific manner against imports of particular products from particular countries. A possible explanation of why global quotas were not used is that while the United States (and Europe) did not want to invite trade conflicts with major trading partners, no similar reluctance was called for with respect to smaller trading partners in the developing world.
Exporters like India and the other countries of subcontinent have had little alternative but “sheer capitulation to far stronger parties in world trade”[12]/. The MFA as administered in practice by importing countries has been so complicated and lacking in transparency that it has made “precise identification of the ex ante effective quotas virtually impossible”.[13]/ Divisiveness among the exporting countries has been inevitable, as each exporter has effectively faced in bilateral negotiations something like a large discriminating monopsonist.
The distortions caused by the MFA have been well-recorded as follows:
“The most efficient suppliers always make best use of the prevailing market conditions. The irony of discriminatory protectionism [like the MFA restrictions] is that good performance is punished. When a supplier shows a potential in a market, its most promising products are covered by quotas. Emerging suppliers usually start with a low coverage ratio and utilization rate… If they perform as expected, they soon hit the quota ceilings in those limited goods. They can move into new products, although these will also become subject to restrictions. Growth of quota ceilings do not catch up with the expansion of successful suppliers’ shipments, and product diversification is more than compensated by imposition of restrictions on the merging products. The moral of the story is that it is not only the exporters of the established suppliers who come under binding constraints. The newcomers, who might to some extent benefit from restrictions on the major suppliers, so find themselves pressed; the more successful they are, the faster and tighter they are embraced by the MFA.”[14]/
From the point of view of reforming the system, what may be more significant is that protective volume restrictions imposed by the MFA damage economic efficiency and welfare in the importing country.
The domestic United States textile industry produces very high quality goods, and has the advantage of close integration with domestic sources of raw materials and the domestic market. Free competition with foreign imports would have reduced costs and achieved even higher standards of quality for the benefit of the American consumer. Restrictions on foreign imports in the form of selective quotas have effectively reduced competition and tended to lower quality and raise costs for the American consumer.[15]/
In short, although the ultimate sources of demand-decisions for Indian products are private businesses and households in the United States economy, the protection of textiles and clothing has transferred potential benefits from the American consumer in the direction of powerful domestic producer lobbies, and in the process reduced the potential value of imports from India and other countries to the American market.
4. Distortions of India’s Trade and Payments
On the Indian side, Indian demands for the world’s exports have been, until the 1990s, completely determined by the centralized economic regime of the Government, which made only indirect reference to the Indian public. Until the start of the current reforms in 1991, Indian commercial and exchange-rate policy was fundamentally based on the official confiscation of foreign exchange earnings of export and hard currency earning sectors, official licensing of imports, and rationing of foreign exchange disbursements according to official priorities.
The roots of this system are to be found in the import quotas imposed on the Indian economy by the British Government in 1940 to conserve foreign exchange and save shipping space on behalf of Britain’s effort in the Second World War, while control of hard currency expenditures were implemented over the whole Sterling Area. All imports were under direct quantitative control by 1942 on the basis of “essentiality” and non-availability from indigenous sources. War needs over-ruled others, and consumer goods were heavily discriminated against, hence favouring domestic production. In 1945, the British Government took a liberalizing step of placing consumer goods imported from Britain into India on open general license. The Government accepted that “the pattern of post-war trade should not be dictated by perpetuation of controls set up for purely war-time purposes”. In 1946 there was pressure for further liberalization of consumer goods in view of large foreign exchange balances accumulated due to India’s war contributions, and foods and consumer goods were placed on universal open general license. Within months, however, by March 1947, there was an end to liberalized imports, and the importation of gold and 200 “luxury” goods were banned. Only a few “essential” goods remained on the open list.[16]/
This experience set the pattern which was followed by the independent governments in India and elsewhere in the subcontinent. Quantitative restrictions on imports and the resulting quantitative exchange-control became primary instruments of Indian commercial policy. Instead of relying on the subtleties of decentralized market flows guided by price-measures like tariffs or exchange-rate changes, economic policy-makers in India and neighbouring countries tended to prefer quantitative actions which could be imposed, reduced or removed by administrative fiat.
With respect to foreign-exchange, from 1940 until when the Indian rupee moved towards market-determination and convertibility on current account in 1992/1993, the general tendency of Indian economic policy-makers was to view the exchange-rate not as an implicit price of the demand for foreign monies relative to domestic money, but as one among a number of administered prices open to be utilized by the Government for its purposes. Foreign exchange earnings of export and other hard-currency earning sectors were confiscated in exchange for Indian rupees at the administered rate, contributing to the thriving parallel foreign exchange market which has been the external trade and payments sector of the large parallel or “black” economy. Gross overvaluation of the rupee may have occurred during this period, contributing to long-term damage to India’s export competitiveness in the world economy.
Foreign exchange obtained from the earnings of exporters were then disbursed by rationing in the following order of precedence: first, to meet the Government’s debt repayments to international organizations and the Government’s expenditures abroad in conduct of its foreign policy like maintenance of embassies and purchase of defence sector imports; secondly, to pay for imports of food, fertilizers and petroleum; thirdly, to pay for imported inputs required by Government-owned firms; fourthly, to pay for import demands of those private firms which had been successful in obtaining import licenses; lastly, to satisfy demands of the public at large for purposes like travel abroad.
For the entire period until the 1990s, India and other countries of the subcontinent have had trade and payments regimes characterized by extensive controls, subsidies, barriers and licensing. Intricate systems of import-licensing based on “essentiality” and “actual user” criteria have been in place in pursuit of generalized import-substitution. In accordance with apparent goals of national economic planning, major industries were nationalized, and these have been leading consumers of imports obtained via administrative rationing of foreign exchange earnings obtained from export sectors. As consumer goods’ imports have been restricted most severely, the predicted consequence has been diversion of the domestic private sector towards production of consumer goods in the large highly protected domestic markets that have resulted, leading to quasi-monopolistic profits and finance of the parallel or “black” economy with its thriving foreign exchange sector. The restriction of consumer goods imports and gold imports has also caused profitable smuggling sectors as well as noticeable corruption in the integrity of customs services.[17]/ In sum, the patterns which have emerged of Indian exports to the USA and American exports to India have been determined by decisions made in quite different institutional contexts of the two economies:
— While American demand-decisions for Indian exports have tended to be decentralized and guided by usual factors affecting market demand, these decisions have been egregiously distorted by the protection of the domestic American textile and clothing industries.
— Indian demand-decisions for American exports have been mostly centralized within the agencies and departments of the Government of India, with only indirect reference made to the Indian public.
5. Analysis of United States Imports from India
The traditional exports of the Indian subcontinent were cotton and cotton goods, foodgrains, jute and jute manufactures, leather and tea, with destinations in Europe, Japan, the United States and China.[18]/ Today the main export markets for India and the neighbouring economies are the European Community, North America and Japan. Among the main exports have been clothing, textiles, leather goods and agricultural materials. Polished diamonds and petroleum have also become major export sectors in India since the 1980s. Tables 5.1. describes the destination and value of the exports from India and neighbouring economies to the rest of the world. Table 5.2. describes the product composition of exports from India and neighbouring economies to North America specifically.[19]/
Focusing on Indian exports to the United States in particular, Tables 5.3.1-5.3.4 describe the nominal and real changes of the four major Indian exports to the United States over the entire period 1962-1991.
In the first ten-year period under consideration, 1962-1971, the dominant Indian export to the United States was textile yarn and fabric (SITC 65). The remaining exports were mainly agricultural products, namely, tea, coffee & spices (SITC 07), fruit and vegetables (SITC 05), sugars (SITC 06), fish and preparations (SITC 03), and crude agricultural matter (SITC 29).
In the next ten years, 1972-1981, this mix was transformed by growth of exports of polished diamonds (SITC 66) and clothing (SITC 84), which along with textile manufactures have dominated Indian exports to the United States ever since. In the most recent decade 1982-1991, the same mix has continued to dominate with the significant addition of petroleum and products (SITC 33), petroleum being the single largest import from India reported by the United States to the U.N. data-base in each year between 1982 and 1985.[20]/
Textile manufactures (SITC 65) were the dominant export until 1978 and have been in the top four throughout the period. But there has been steady decline in real terms. The decline has been from an annual average, in constant 1990 U. S. dollars, of $740 million (c.i.f) in 1962-71, to $406 million in 1972-1981, to $285 million in 1982-1991. As indicated by Table 5.4 and Chart 5.1, India has steadily lost market-share in total textile imports into the United States, dominating the market with an average annual market-share of 20 percent in 1962-1971, reduced to 10 percent in 1972-1981, reduced further to less than 5 percent in 1982-1991. The imposition of American quotas has undoubtedly affected this loss in part.
Clothing (SITC 84) during the same period has shown high real growth, going from an annual average, in constant 1990 U. S. dollars, of $7 million in 1962-1971 to $178 million in 1972-1981, to $538 million in 1982-1991. Average annual market-share of total U. S. imports of clothing has gone from 0.10 percent in 1962-1971, to 2.11 percent in 1972-1981, to 2.34 percent in 1982-1991. While this has been small growth from the point of view of the U. S. market, the movement has been large relative to initial conditions from the point of view of Indian exporters. As shown in Table 5.5, there has been large-scale real growth of clothing from all countries of the subcontinent to the major industrial countries especially in the decade 1982-1991. Not only has there been remarkable growth in real terms of clothing exports from the entire region, but there has been relatively higher growth in Pakistan compared to India, and higher growth in Sri Lanka and Bangladesh compared to Pakistan. It is likely that some of the growth from Sri Lanka and Bangladesh has been derived from Indian capital investment in those countries to make use of their allocated quotas in U. S. protectionism. It is possible also that there has been substitution on the part of Indian exporters from textiles towards clothing in response to non-tariff barriers.
Overall, the story of Indian exports to the United States may be summarized by saying that while the long-run product composition has changed over thirty years, it has not done so in ways that had been expected or hoped for by India’s national economic plans. India has not become a major industrial power or even a significant small exporter of industrial goods in the world economy, as had been wished for by the framers of the Second Five Year Plan in the 1950s.[21]/
Textile manufactures, clothing, polished diamonds and petroleum account for approximately 70 percent of Indian exports to the United States.
Traditional exports like textiles and tea have seen drastic declines. While it is not clear whether clothing is traditional or non-traditional, there has been remarkable growth in that sector in the 1980s. Petroleum exports were not anticipated in India’s national plans yet dominated the short export boom which seems to have been registered in the early 1980s. Polished diamonds have shown spectacular growth as a result of Indian entrepreneurship at its best; however, value-added is significantly lower in view of the high import value of uncut diamonds imported via Belgium from South Africa. Although these are classified as “gems and jewelry”, to the extent the uses of diamonds have been industrial in the metal-working industries of the main importing countries of the USA, Germany and Japan, future growth of this sector may be affected by, for example, large expected sales of industrial diamonds by the United States Defense Department from strategic reserves held during the Cold War.
6. Analysis of Indian Imports from the United States
We turn next to examine India-United States merchandise trade from the other side.
In view of India’s commercial and exchange-rate policies described in Section 2, diverse factors appear to have affected the Government of India’s demand for American exports, including agricultural fluctuations, the Green Revolution and the state of international political relations.
Tables 6.1-6.3 describe the main trends to be detected in Indian imports from the United States. In the first ten-year period under consideration, 1962-1971, a dominant place in American exports to India was taken by food imports, mainly cereals like wheat, rice and corn (SITC 04). American institutions especially the Ford and Rockefeller Foundations played key roles in the mid 1960s in persuading India’s Food and Agricultural Minister, C. S. Subramaniam, to promote adoption of high-yielding varieties of wheat and rice in selected areas of the country. This went against the advice of most Indian economists at the time[22]/, and in fact against the interests of America’s own farm lobbies as well.
Two direct results of this decision can be noticed in the trade-data reported in Tables 6.1-6.3. As is well-known, India was able to increase domestic food production spectacularly, permitting the reduction of cereal imports from the United States. Instead, India began since the mid-1960s to make large imports from the United States of manufactured fertilizers (SITC 56.2), which remain the single largest American export to India today at three-level SITC. American advice and assistance in stimulating the Green Revolution in India has certainly been a signal achievement of India-United States economic cooperation in the past.
The decline in Indian imports of American cereal in nominal and real terms can be seen in Table 6.4. In constant 1990 US dollars, average annual cereal imports have declined from $630 million in 1962-1971, to $295 million in 1972-1981, to an estimated $160 million in 1982-1991. Although the trend in Indian cereal output has been towards greater self-sufficiency, a random element still appears depending on the vagaries of the monsoon and the Government’s management of the country’s food-stocks. This is indicated by the large surges in cereal imports of 1975, 1976, 1983 and as recently as 1988.
Other than foods, a large component of American exports to India has been machinery and transport equipment, including aircraft and aircraft parts. Table 6.4. indicates that during the 1970s when India-United States political relations were not at their best, a distinct fall in real terms can be discerned of Indian imports of American machinery and transport equipment. Indian quotas for textile imports into the United States also likely suffered from weak political relations at the time.
Since the 1980s, American manufactured exports have started to climb again. In constant 1990 U. S. dollars, average annual imports of American machinery and transport into India was $717 million in 1962-1971, down to $456 million in 1972-1981, rising again to an estimated $673 million in 1982-1991.
The sporadic aspect to some of the Indian demand for American exports may be noticed also in case of the sudden large increases in imports of fixed vegetable oil (SITC 42) between 1977 and 1980, and in imports of cotton fibres (SITC 26) in 1977 and 1979.[23]/
In the period 1982-1991, the composition of Indian imports from the United States has seen some change with the growth of scrap iron ore and waste (SITC 28.2); precision instruments (SITC 87.4); pulp and waste paper (SITC 25); crude fertilizers (SITC 27); chemical elements and compounds (SITC 51), and plastics (SITC 58). Along with manufactured fertilizers and machinery and aircraft, these presently dominate United States exports to India.
As reported by the United States Commerce Department, India’s restrictive trade barriers in the past led to many American companies identifying potential export items but simply giving up in the face of quantitative restrictions and steep tariffs. Following the start of the economic reform process in July 1991, the United States has expressed the expectation that greater openness and transparency in the Indian trade-regime will lead to a significant increase in trade and investment. Lower Indian tariff barriers are expected to benefit a number of American exporters who presently face the tariff levels indicated: fertilizers (60 percent); wood products (110 percent); ferrous waste and scrap (85 percent); computers, office machinery and spares (95 percent); soda ash (over 50 percent); heavy equipment spares (80 percent); medical equipment components (40 percent); copper waste and scrap (50 percent); and agricultural products (135 percent).
7. Prospect
Economics, when candidly treated, is indeed the dismal science, and any candid assessment of India-United States merchandise trade may have to conclude that there is no compelling reason at present to expect large movement away from past trends.
In the opinion of the author, sources of significant new growth in Indian exports to the United States, and indeed to the rest of the world, do not seem to be easily identifiable.[24]/ While small advances may well be made in new sectors by Indian exporters, the great bulk of Indian export earnings from the United States market will continue to be accounted for by textile manufactures (SITC 65), clothing (SITC 84), polished diamonds (SITC 66) and petroleum and products (SITC 33).
Of these, diamonds and petroleum may be expected to face fluctuating demand conditions, while textiles and clothing will continue to face high non-tariff barriers. Given the political strength of the domestic textile and clothing industry in the United States, such a situation may be nearly permanent, or at least no change can be expected in the near future. The fact that the United States remains the single largest trading partner for India, while India in 1992 was the USA’s 36th largest export market (down from 25th in 1986) accounting for less than 1 percent of total American trade and barely 3 percent of American trade with all of Asia, makes it inevitable that a disparity of economic power will affect the course of bilateral economic relations.
Successful commerce depends on intangible quantities like trust, reliable information and contacts between individual contracting parties. The declines in real terms which seem to have occurred in India-United States commerce in the past have led to wastage of this kind of informational capital and commercial trust. American importers and exporters have established new relations with others among India’s competitors in East Asia and Latin America. For Indian entrepreneurship to win back old customers and investors or win new ones will be extremely difficult. The radical changes in Indian economic policy of the last few years have at least reduced Government-imposed barriers towards this — vindicating the tiny minority of critics, starting with Shenoy, who had more or less correctly diagnosed the folly of India’s economic policies now abandoned. As in Kalidasa’s story of the man cutting the branch of the tree on which he sits, the cutting at least appears to have ceased for the time being.
From the point of view of American exporters to India, prospects may seem more promising in view of the breakthrough which has been achieved in Indian economic policy-thinking in the last few years. The large potential scope for expansion of India-United States trade depends squarely on (a) the deepening of Indian reforms; and (b) removal of the egregious American protectionism in textiles and clothing.
American exports to an enormous market-based Indian economy founded on principles of private property and free exchange, with democratic political institutions and an open society (and assuming political stability), will come to depend eventually on the price and quality of American products and the income-levels of Indian importers. But these ultimate factors can only be improved by the growth of Indian exports in turn. Large-scale real growth of exports from India are necessary not only if the Indian market is to generate effective demand for foreign imports, but even to finance the large external borrowings on capital account on which the entire adjustment depends. It is in such a context that the constraints on Indian textiles and clothing exports imposed by powerful domestic producer interests in the importing economies have to be seen.
The most promising source of export earnings for India may be in fact via a multilateral forum if there could be a successful completion of the Uruguay Round trade talks. It has been estimated that with a 30 percent reduction in tariffs and non-tariff barriers in the USA, Europe and Japan, India’s exports to these markets would grow by more than $1.8 billion over the actual 1991 exports of $5.6 billion. With a 50 percent liberalization, the growth would be almost $3 billion more than the actual 1991 figure.[25]/
Although completion of the Uruguay Round itself may be a subject of wishful thinking, Indian external economic policy would be well-advised to base itself on the principle of increased world trade and access to markets, including reduction of barriers to movement of capital and labour.
References
Balassa, Bela (1978), “Export Incentives and Export Performance in Developing Countries: A Comparative Analysis”, Weltwirtschaftliches Archiv 114.
Balassa, Bela (1980), The Process of Industrial Development and Alternative Development Strategies Princeton Essays in International Finance 141.
Bhagwati, Jagdish & Padma Desai (1970) India: Planning for Industrialization, OECD, Paris.
Bhagwati, Jagdish & T. N. Srinivasan (1975) Foreign Trade Regimes and Economic Development: India National Bureau of Economic Research, New York.
Chaudhuri, K. N. (1982) “Foreign Trade and Balance of Payments 1757-1947” in The Cambridge Economic History of India edited by Dharma Kumar, Cambridge University Press.
Cline, W. (1987) The Future of World Trade in Textiles & Apparel, Inst. for Int. Economics, Washington D. C.
Desai, Ashok (1991), “Output and Employment Effects of Recent Changes in Policy”, in Social Dimensions of Structural Adjustment in India, ILO, New Delhi 1991.
Erzan, Refik, Junichi Goto & Paula Holmes (1989) “Effects of the Multi-Fibre Arrangement on Developing Countries’ Trade”, World Bank International Economics Department WPS 297.
Friedman, Milton (1992) “A Memorandum to the Government of India 1955”, in Subroto Roy & William E. James (eds), Foundations of India’s Political Economy: Towards an Agenda for the 1990s, Sage.
Hamilton, C. B. (1988), “Restrictiveness and International Transmission of the New Protectionism”, in R. Baldwin, C. B. Hamilton and A. Sapir (eds), Issues in US-EC Trade Relations, University of Chicago Press.
Hopper, David (1978) “Distortions of Agricultural Development Resulting from Government Prohibitions” in T. W. Schultz (ed.) Distortions in Agricultural Incentives, Indiana University Press.
Hufbauer, Gary, D. Berliner and K. Elliott (1986) Trade Protection in the United States: 31 Case Studies, Institute for International Economics, Washington D. C.
International Monetary Fund (1992) International Financial Statistics.
Keynes, John Maynard (1920) The Economic Consequences of the Peace, Harcourt, New York.
Primo Braga, C. & Alexander Yeats (1992) “How Minilateral Trading Arrangements May Affect the Post-Uruguay Round World”, World Bank International Economics Department WPS 974.
Roy, Subroto (1984) Pricing, Planning and Politics: A Study of Economic Distortions in India, Institute of Economic Affairs, London.
Roy, Subroto (1990) “Draft Memorandum on India’s Agenda 1990-2000: Notes on Policy for the First 18+ Months of a 5-Year Term”, a confidential memorandum to Rajiv Gandhi, October 26 1990. (Published versions have appeared as “A Memo to Rajiv, I, II, III”, The Statesman July 31-August 2 1991).
Roy, Subroto (1993) “Exchange Rate Policies in South Asia”, unpublished study, International Monetary Fund.
Safadi, Raed and Alexander Yeats (1993) “NAFTA: Its Effect on South Asia”, World Bank International Economics Department Working Paper.
Shenoy, B. R. (1955) “A Note of Dissent”, Papers Relating to the Formulation of the Second Five Year Plan, Government of India Planning Commission, New Delhi.
Sims, Holly (1988), Political Regimes, Public Policy & Economic Development: Agricultural Performance and Rural Change in Two Punjabs Sage.
Srinivasan, T. N. (1992) “Planning and Foreign Trade Reconsidered”, in Foundations of India’s Political Economy edited by Subroto Roy & William E. James, Sage.
Tarr, D. and M. Morkre (1984) Aggregate Cost to the United States of Tariffs and Quotas on Imports, United States Federal Trade Commission.
Tomlinson, B. R. (1992) “Historical Roots of Economic Policy” in Foundations of India’s Political Economy edited by Subroto Roy & William E. James, Sage.
United Nations (1955) Yearbook of International Trade Statistics.
World Bank (1992) Global Economic Prospects and the Developing Countries, Washington D. C.
[1]/ …..The author is a consultant economist in the Washington area. His publications include Philosophy of Economics (Routledge 1989), and (co-edited with W. E. James), Foundations of India’s Political Economy: Towards an Agenda for the 1990s and Foundations of Pakistan’s Political Economy: Towards an Agenda for the 1990s (Delhi & Karachi: Sage & OUP 1992). Correspondence may be addressed to…. Va. 22209.
[2]/ This data is made available by the kind courtesy of John Simmons of the United States Commerce Department.
[5]/ Keynes (1920 p.197), table on German trade by value, origin and destination.
[8]/ Balassa (1978 p. 39), Balassa (1980 p.16).
[11]/ John Maynard Keynes’s description of the Versailles Conference is perhaps the most graphic picture of America’s rise to predominance over Europe since the end of the First World War: “[T]he realities of power were in [President Woodrow Wilson’s] hands. The American armies were at the height of their numbers, discipline, and equipment. Europe was in complete dependence on the food supplies of the United States; and financially she was even more absolutely at her mercy. Europe not only already owed the United States more than she could pay; but only a large measure of further assistance could save her from starvation and bankruptcy.” Keynes (1920, p.38).
[12]/ Erzan et al. (1989) p.38.
[13]/ Erzan et al (1989), p.1.
[14]/ Erzan et al (1989, p.17)
[15]/ On the economic costs incurred by importing countries from protecting their domestic textile sectors from import competition, see for example Erzan et al (1989), Cline (1987), Hamilton (1988), Hufbauer et al (1986), and Tarr & Morkre (1984).
[17]/ The multiple distortions of domestic and external sectors of the economy caused by these procedures have been documented and analyzed by a number of observers. Early advocacy of liberal economic policies and a market-determined rate for the rupee came from Shenoy (1955) and Friedman (1992). The treatment of B. R. Shenoy, as a result of his prescient and singular critique of conventional majority-views at the time, remains a permanent disgrace upon the Indian economics profession. Friedman’s statement was similarly neglected, and remained unpublished and undiscussed among Indian economists from 1955 to 1992. Later advocates of similar positions include Bhagwati & Desai (1970); Bhagwati & Srinivasan (1975) and Roy (1984). See also Desai (1991), Srinivasan (1992), and Roy (1993).
[18]/ Chaudhuri (1982). Britain (23.5 per cent of total value), Japan (10.8 per cent), the United States (9.4 per cent), Germany (6.5 per cent), China (6.0 per cent) and France (5.0 per cent). The value composition of exports was: raw cotton (21.0 percent), cotton goods (1.6 percent), foodgrains (13.5 percent), raw jute (5.8 per cent), manufactured jute goods (14.5 per cent), hides and skins (8.1 per cent) and tea (10.7 per cent). All figures for 1930-1931.
[19]/ Tables 5.1 and 5.2 are reproduced from Safadi & Yeats (1993) with the kind permission of the authors.
[20]/ A discrepancy exists in the data as Indian data to the UN do not report any exports of petroleum to the USA or France in these years, when both the USA and France report receiving such imports as the top import from India. It is possible for an exporter to export without knowing the final destination of a product.
The author has not been able to determine if India’s petroleum exports were of crude oil, e.g. because of lack of refining capacity in India; or of non-crude classified as SITC 33.4. The United States Embassy in New Delhi in the mid 1980s suggested the former; latest U. S. Department of Commerce data suggest the latter.
[21]/ Developing countries among the world’s 25 largest exporters of high-tech manufactured goods as of 1988, with their share of world high-tech exports and value of high-tech exports were: Taiwan (3.2 percent, $16.6 million); Korea (2.9 percent, $14.7 million.); Singapore (2.4 percent, $12.5 million.); Hong Kong (1.6 percent, $8.4 million.); Mexico (1.4 percent, $7 million.); Malaysia (1.2 percent, $6 million.); China (1.1 percent, $5.4 million.); Brazil (0.6 percent; $3 million.); Thailand (0.4 percent; $1.9 million.); from Braga & Yeats (1992, p.29).
[22]/ See Hopper (1978) for an eyewitness account of how Subramaniam was prevailed upon to go against the advice of his advisers, which he did, leading to the largest seed transfer in history of 18,000 tons from Mexico to India. Also Sims (1988, p. 38).
[23]/ India buying cotton fibres from the world market and Pakistan selling cotton fibres to the world market is one of the ironies of the economic division of the subcontinent.
[24]/ The prediction made in Roy (1990) of an export boom following economic reforms has proven to be erroneous, in spite of the progress made in changing the broad direction of Indian economic policy. This was a memorandum dated October 26 1990 written at the invitation of the late Rajiv Gandhi then Leader of the Opposition, which contributed to the Congress Party’s economic manifesto in 1991. Mr. P. Chidambaram, former Commerce Minister in the Narasimha Rao Government, received the memorandum in hand from Mr. Gandhi in late October 1990. He has recently said that the economic reform program “was not miraculous” but was in fact based on the rewriting of the Congress manifesto when the Congress Party was in Opposition. “We were ready when we came back to power in 1991”. News India April 30 1993, p. 33.
[25]/ World Bank (1992, Appendix C2, p.52). Safadi & Yeats (1993) estimate that India may have lower exports to North America by up to $17 million dollars from trade-diversion towards Mexico as a result of the North American Free Trade Association. They affirm the overwhelming importance for India of the gains from the Uruguay Round in response to regionalism.
